
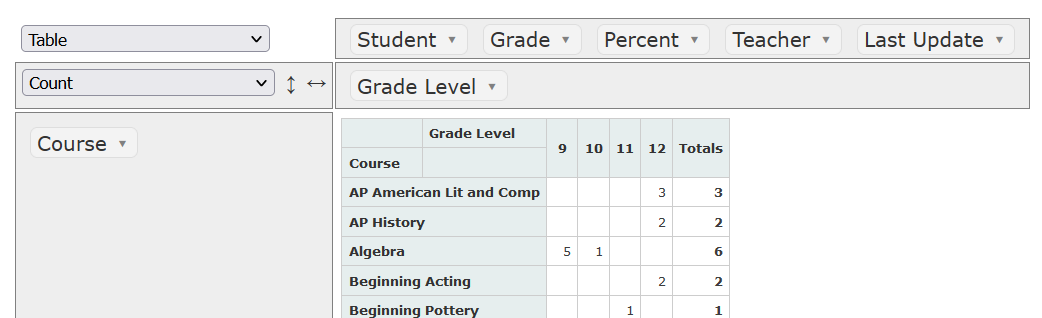
The Online Pivot Tables plugin is a free plugin that works with sqlReports, but can also be used to analyze data from other reports and/or SIS export options. Below is an example of a pivot table based on data from the output of the Current Grades Report - No Minimum sqlReport.
Overview
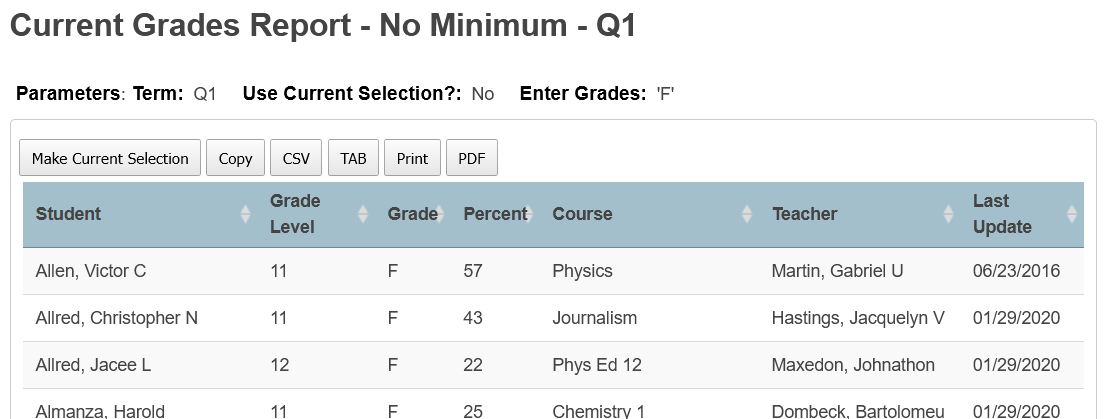
After the sqlReport is run, the data is copied by clicking on the Copy button of the report output:
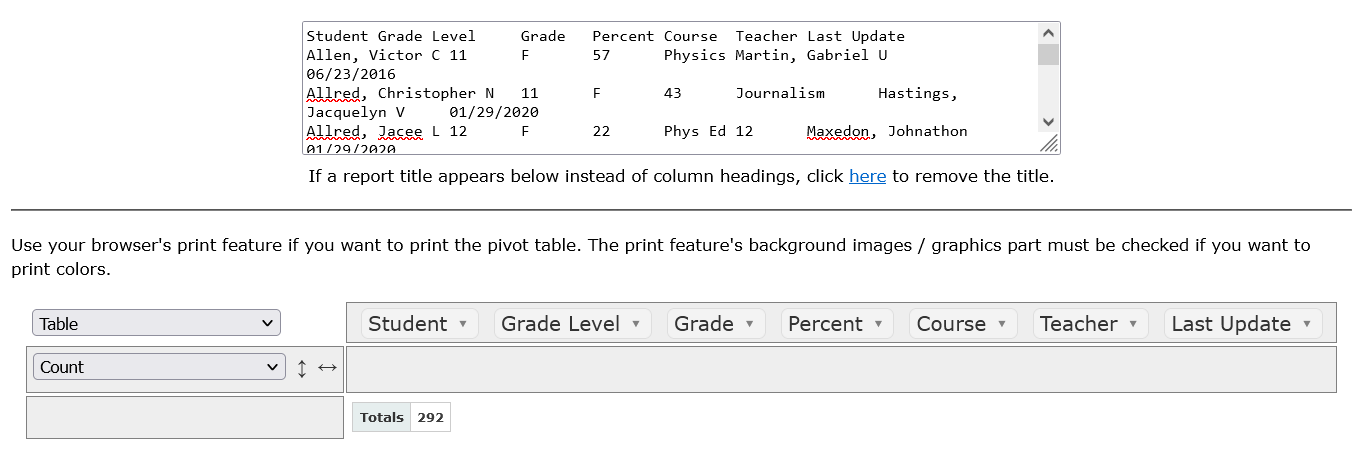
Once copied, the data is pasted into the box on the Online Pivot Tables page. Doing so creates a work area with the column headings from the report.
The column headings can be dragged and dropped into different areas to create various pivot tables or charts. In the screenshot below, the Grade Level column heading was placed in the columns area and Course placed in the rows area. Above the rows area is a drop-down where one can choose aggregate functions, such as Count in the screenshot below, and above that a drop-down to choose the output type.
In addition to copying data from a sqlReport, data could be copied from reports built into the SIS or from custorm report page, or one could upload a CSV file created by an export.
The plugin is based on the free open source software located at this web site.